This article really has nothing to do with weight loss. It is an article about business intelligence. But there is a direct relationship. Stay with me.
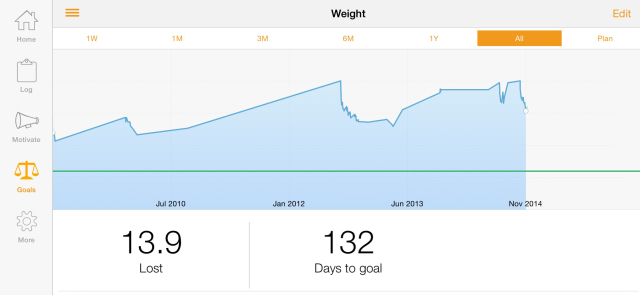
Those who know me know that I struggle with the common problem of weight gain. Those of us that love food share this problem in  common. It is, to say the least, a struggle. For more than five years I have been tracking, on and off, my food intake and my weight in a mobile App called Lose-it. The specific numbers have been wiped from view to avoid further embarrassment. The chart clearly shows the upward climb when the cycle is Off and the downward decent when the cycle is On. It is very clear, when you record your weight and understand your intake, you will lose weight. When you ignore your weight and your intake, you will gain weight if you are predisposed to gain weight like I am. So what is the problem? Why can’t I persist and maintain the On schedule. Well understanding what I now understand through the clarity of graphic intelligence, I think I can. I really do.
So how does this relate to business and why am I sharing this personal information with you? Because the same thing that applies to weight loss applies to business. Watching intake and outflow and managing your business will improve results. The issue is how do you view your business intelligence? This – business intelligence or BI – is a subject that is beginning to get some legs. Oracle, IBM, SAP and Microsoft are working hard to ease these tools into existing software architecture.
Over the coming months we will be working with Microsoft BI tools and your SQL Server data to help you get a better view of your ins / outs and gains / losses. Like the chart above, business charts and graphs reviewed regularly and systematically will help the decision making process towards success – whatever that looks like to you! Stay tuned!
