
Maps are fun, informative and sometimes great for making a point. Add data to maps and you have information squared. Here is a map of Eastern Massachusetts and surrounding areas broken out into 3-digit zip code areas.
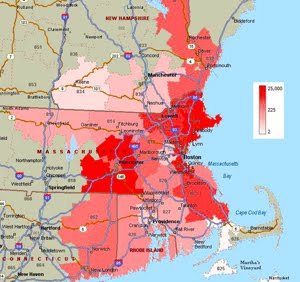
The map details where we have spent our time over the last 10 years. Other areas of the country have been omitted, but this gives you an idea of where our clients are based. The very bright red areas represent more than 20,000 man-hours, the bright pink is 1,000+ man-hours and the light pink less than 1,000.
It’s interesting to see a long history of data painted onto a map and even more interesting if you look at the maps from year to year.
Think about your data and how you might evaluate your business on a map of the State, region or Country.
Creating this map took less than 10 minutes. Creating the data for this map took more than 10 years. Maps can be helpful looking at a decade, year, month or even a day worth of data.
A word about zip codes, zip codes make mapping easy. If you are not capturing zip codes in your business, think again.